Federal arts and cultural policy is evolving rapidly. Stay informed and take action through Creative West’s Action Center.

The Creative Vitality Index
返回所有新闻


CREATIVE VITALITY INDEX

1 月 14, 2019

The Creative Vitality™ Index compares the per capita concentration of creative activity in two regions. Data on creative industries, occupations, and cultural nonprofit revenues are indexed using a population-based calculation. The resulting CVI Value shows a region’s creative vitality compared to another region.

Similarly to how Body Mass Index (BMI) can serve as an approximation of your body’s health, the CVI has been designed to approximate a region’s creative economic health. The benefit of indexes like these is in their ability to quickly and simply communicate, in a single number, how many variables interact with each other.

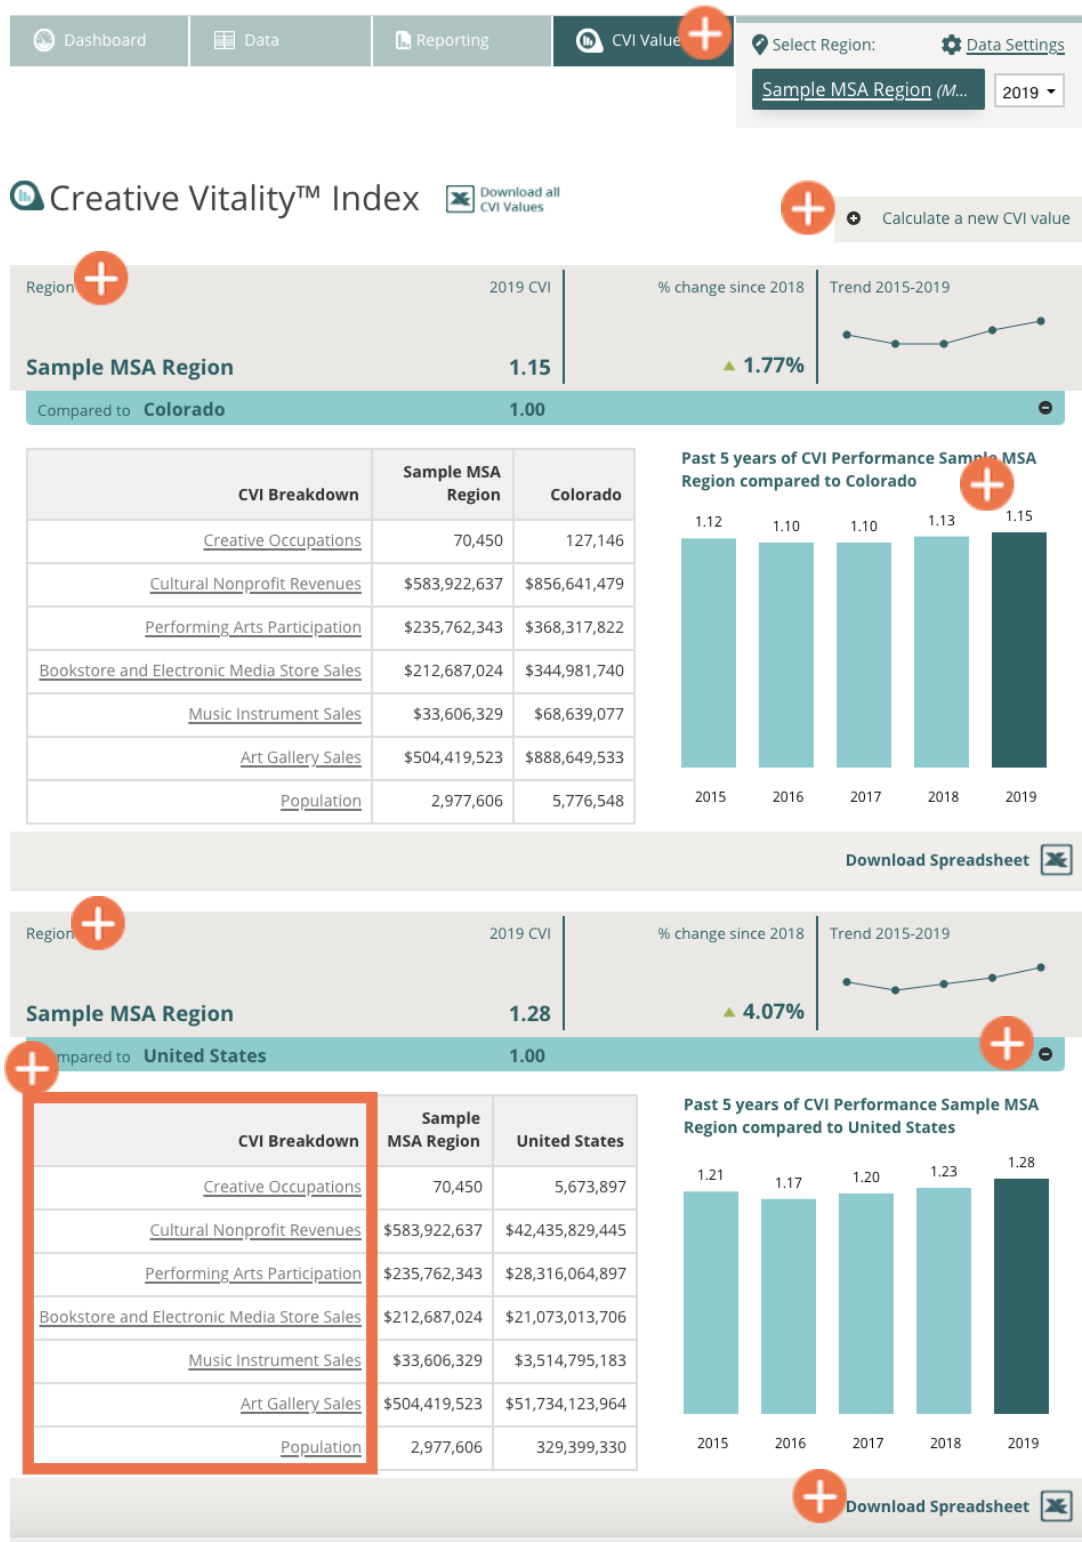
That single number, the CVI, is a ratio of all of the integrated creative economic variables compared to the United States, which has a CVI value of 1. For example, the creative vitality of a region with a CVI value of 1.5  is 0.5 times more concentrated than the national average.

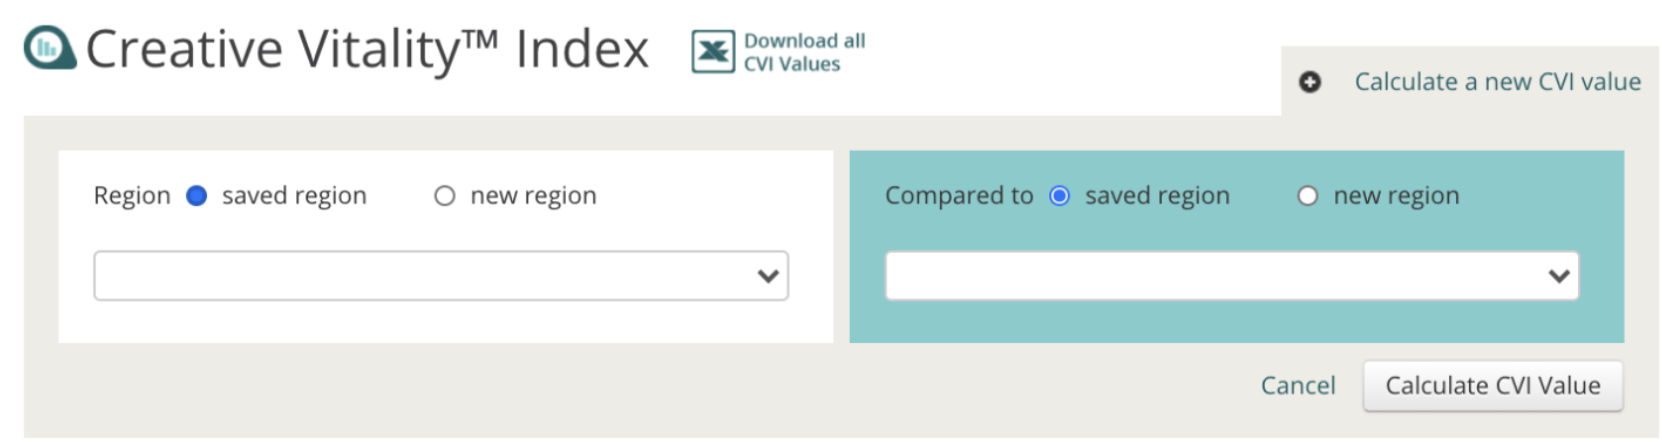
The CVI has a number of uses. The Index can serve as a diagnostic tool to identify strengths and weaknesses in an area’s creative economy. From that diagnosis, community leaders can strategize to encourage growth in a particular segment of the creative sector of their local economy. The Index can also be used to benchmark work in a certain segment of the creative economy and to track progress against that benchmark. Finally, the CVI is a credible source of data that can serve as a point of departure for a discussion about the scope and relative health of an area’s creative economy with a variety of stakeholders.

CVI INDICATORS

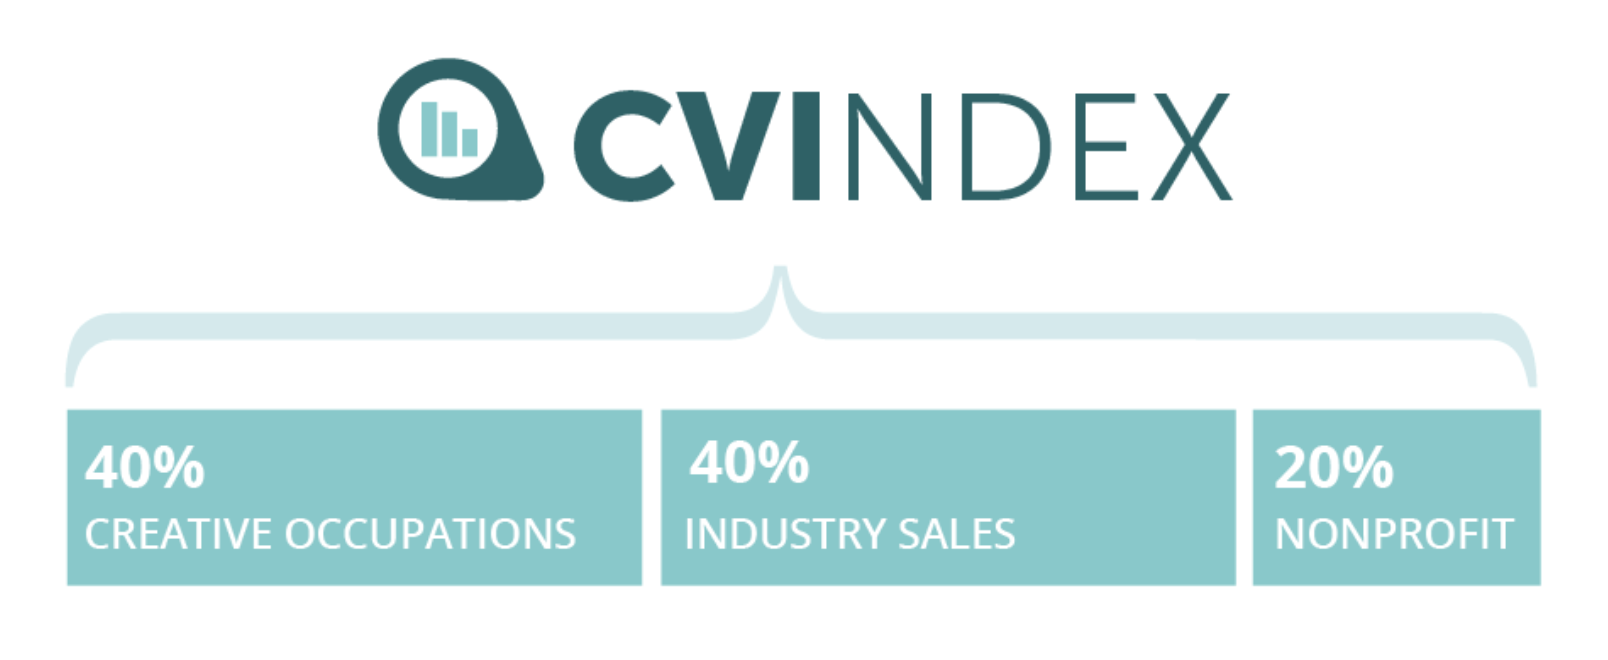
The CVI is built from four indicators: number of jobs within specific creative occupations, industry sales from specific industries, and arts and culture nonprofit revenues.

These indicators give a broad picture of the health of a region’s overall creative economic health. Choosing the exact indicators stemmed from conversations around combining economic development and nonprofit sector methodologies to help the field better understand the creative economy. Once thought to be independent areas of study, the for-profit and nonprofit indicators were chosen due to their correlation with a region’s overall creative economic health. For the detailed list of occupations, industries, and nonprofits visit our CVSuite Codes page.

2024.1 CVI Methodology Update

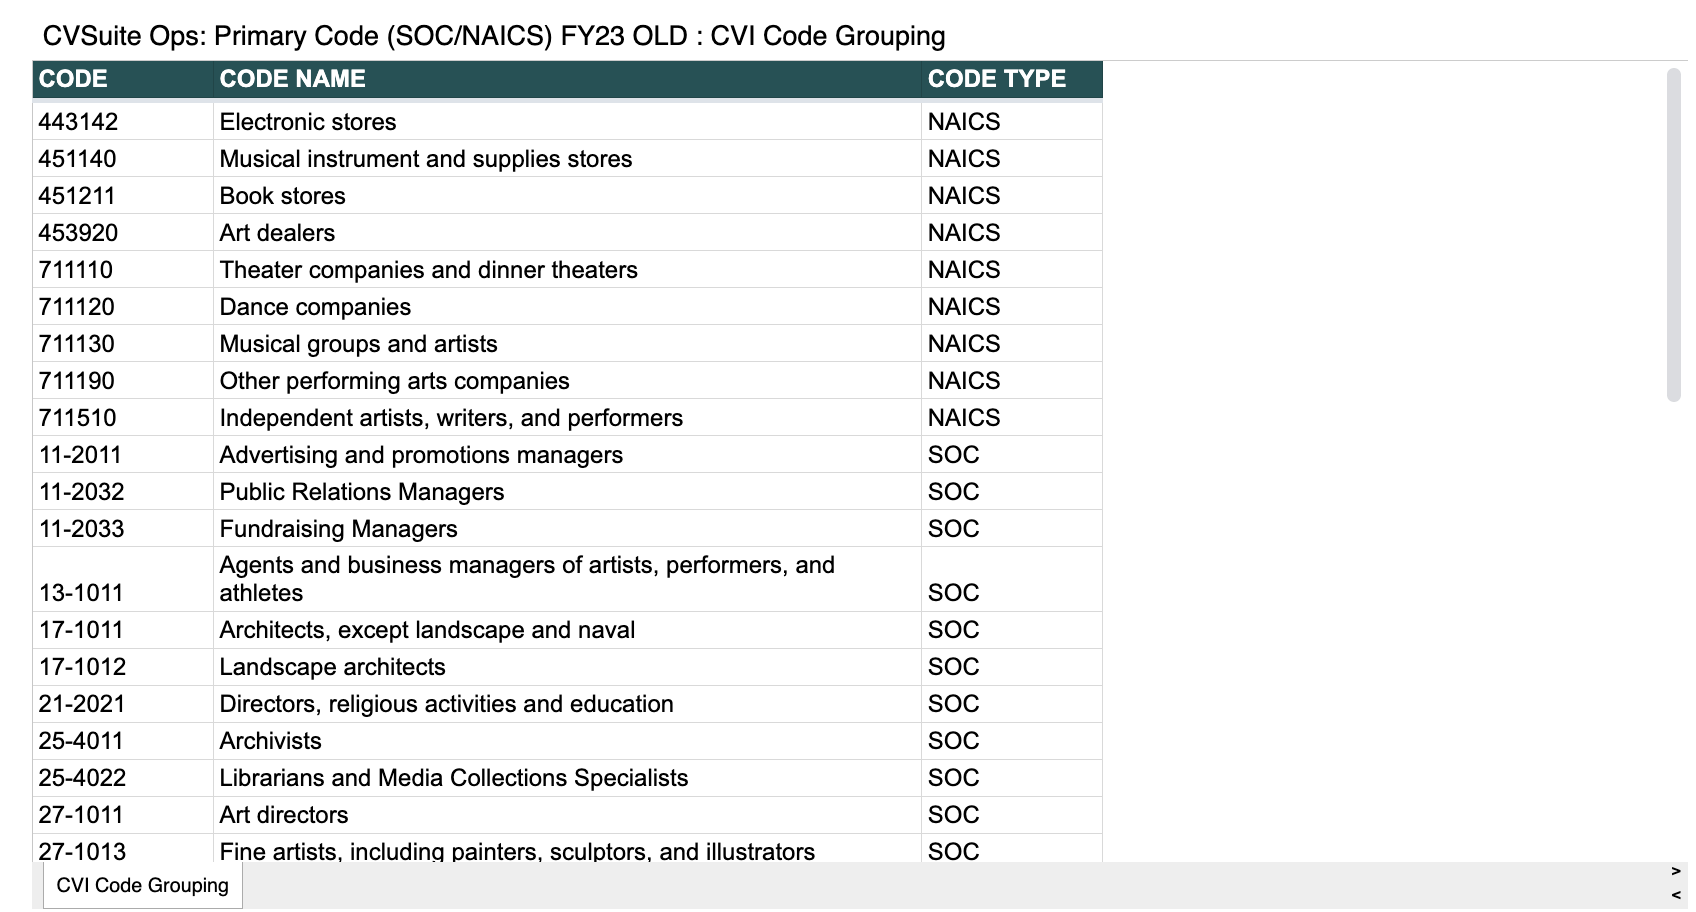
With the 2024.1 update, we also updated our NAICS definition to the 2022 definition. This affects the CVI calculation in two ways:

  • The CVI values for data years 2022 and 2021 will use the new 2024 methodology.
  • The CVI values for data years 2020 – 2011 will use our older 2023 methodology.

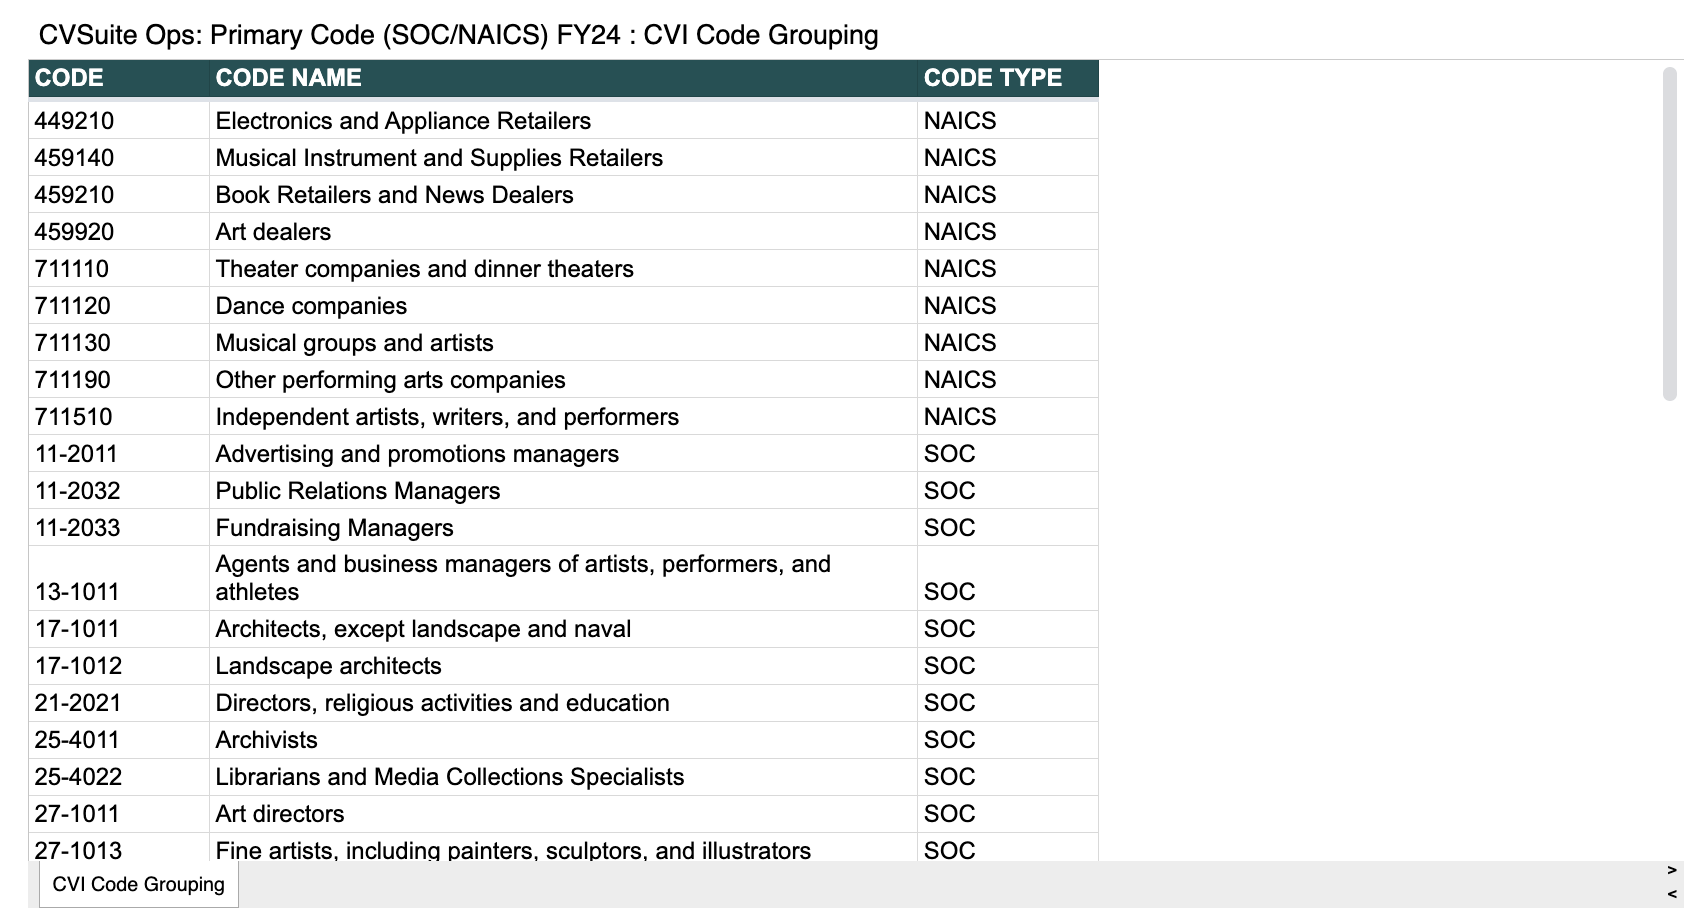
2022 – 2021 CVI Values | 2024 Methodology 

The 2022 and 2021 CVI values use our new 2024 methodology and are based on these NAICS and SOC codes:

CVSuite Ops: Primary Code (SOC/NAICS) FY24: CVI Code Grouping

2020 – 2011 CVI Values | 2023 Methodology 

CVI values for data years 2020 – 2011 will use our older 2023 methodology and are based on these NAICS and SOC codes:

CVSuite Ops: Primary Code (SOC/NAICS) FY23 OLD: CVI Code Grouping

THE CVI IN CVSUITE

CVI Breakdown

The CVI Value in CVSuite is set by default to show the creative vitality of the region selected compared to the U.S. This default value can be found on the left hand side of the dashboard and within the Snapshot Report. Refer to the New to CVSuite guide on where to locate your selected region’s CVI value.

To access the CVI and compare regions, select the CVI Value from the top menu. This will take you to the CVI page where you can see the CVI value and create new CVI comparisons.

COMPARING REGIONS WITH THE CVI

If your created region is State level, then you will see it compared only to the United States. If your region is MSA, County, or ZIP Code level, you will see it compared to both the United States and the State in which your region is located.

It is also possible to quickly compare two custom regions by clicking the “Calculate a new CVI value”. A new region selection tab will display, as shown below:

Screenshot 2026-01-14 at 10.12.24 AM

This tab will allow you to select two regions to compare based upon regions you have previously created or you can select a comparison region from any of the geographies included in your account.

INTERPRETING THE CVI

By default, only the CVI value, CVI percent change since previous year, and 5-year CVI trend are shown on the CVI page. Clicking the “+” button will display the creative occupations’ job numbers, creative industry sales, nonprofit revenues, and regional population that make up the CVI.

订阅我们的电子邮件通讯:

Web 服务由

创意西部

CaFELogo150x80x2Artboard-1@2x

CaFÉ 是一个在线申请提交系统,致力于通过为艺术组织提供实惠的提交平台和为艺术家提供简便的申请方式,让所有人都能获得艺术机会。

裁剪-GOSmart-徽标-蓝绿色-原始-2-e1719505570844

GO Smart 是一款价格实惠的资助管理软件,为资助者提供申请前和申请后表格、小组审查和数据报告。

PAA-2023-高分辨率

公共艺术档案馆 (PAA) 是一个免费、可搜索且不断增长的在线数据库,其中包含美国和国外已完成的公共艺术品,以及一套用于管理公共艺术收藏的资源和工具。

ZAPP_RGB 2 复制代码

ZAPP 为艺术博览会和艺术节管理员提供了一套工具,用于以数字方式收集和评审申请、管理展位付款以及与申请人沟通,所有这些都在一个易于使用的数字平台上完成。艺术家可以通过一个中央网站申请参加全国数百场展览。