


Servicios web con tecnología

The European Commission recently released the first edition of a new tool to monitor and assess the performance of Cultural and Creative Cities in Europe. According to the Cultural and Creative Cities Monitor website, 168 cities were selected in 30 European countries and were measured on how well these cities perform on a range of selected measures grouped along a nine-dimensional model describing the Cultural Vibrancy, el Creative Economy y el Enabling Environment of a city.
Similar to the CVSuite, the Cultural and Creative Cities Monitor provides organizations with the data to to benchmark their cities, compare cities, and assist in policy. According to their website, “The Cultural and Creative Cities Monitor supports the European Commission’s efforts to put culture at the heart of its policy agenda. It provides a common evidence base at city level that illuminates culture and creativity’s contribution to improving socio-economic perspectives and resilience.”
https://youtu.be/XrTuLJacOEo
The Methodology
The Monitor, like CVSuite’s Creative Vitality Index (CVI), has an index which is comprised of a variety of indicators that are then weighted and shown as per capita figures. The Monitor measures the 168 cities using both quantitative and qualitative data. CVI provides data more broadly, covering all counties and ZIP Codes in the US. The quantitative data used by the Monitor are captured through 29 indicators relevant to 9 dimensions that reflect three major areas, including Cultural Vibrancy, Creative Economy, y Enabling Environment. The Monitor goes beyond the CVI by providing information about the quality of life in a region. These qualitative data provide key information about a city’s cultural and creative assets and can include–but are not limited to–artistic institutions, live events, policy strategies, etc.
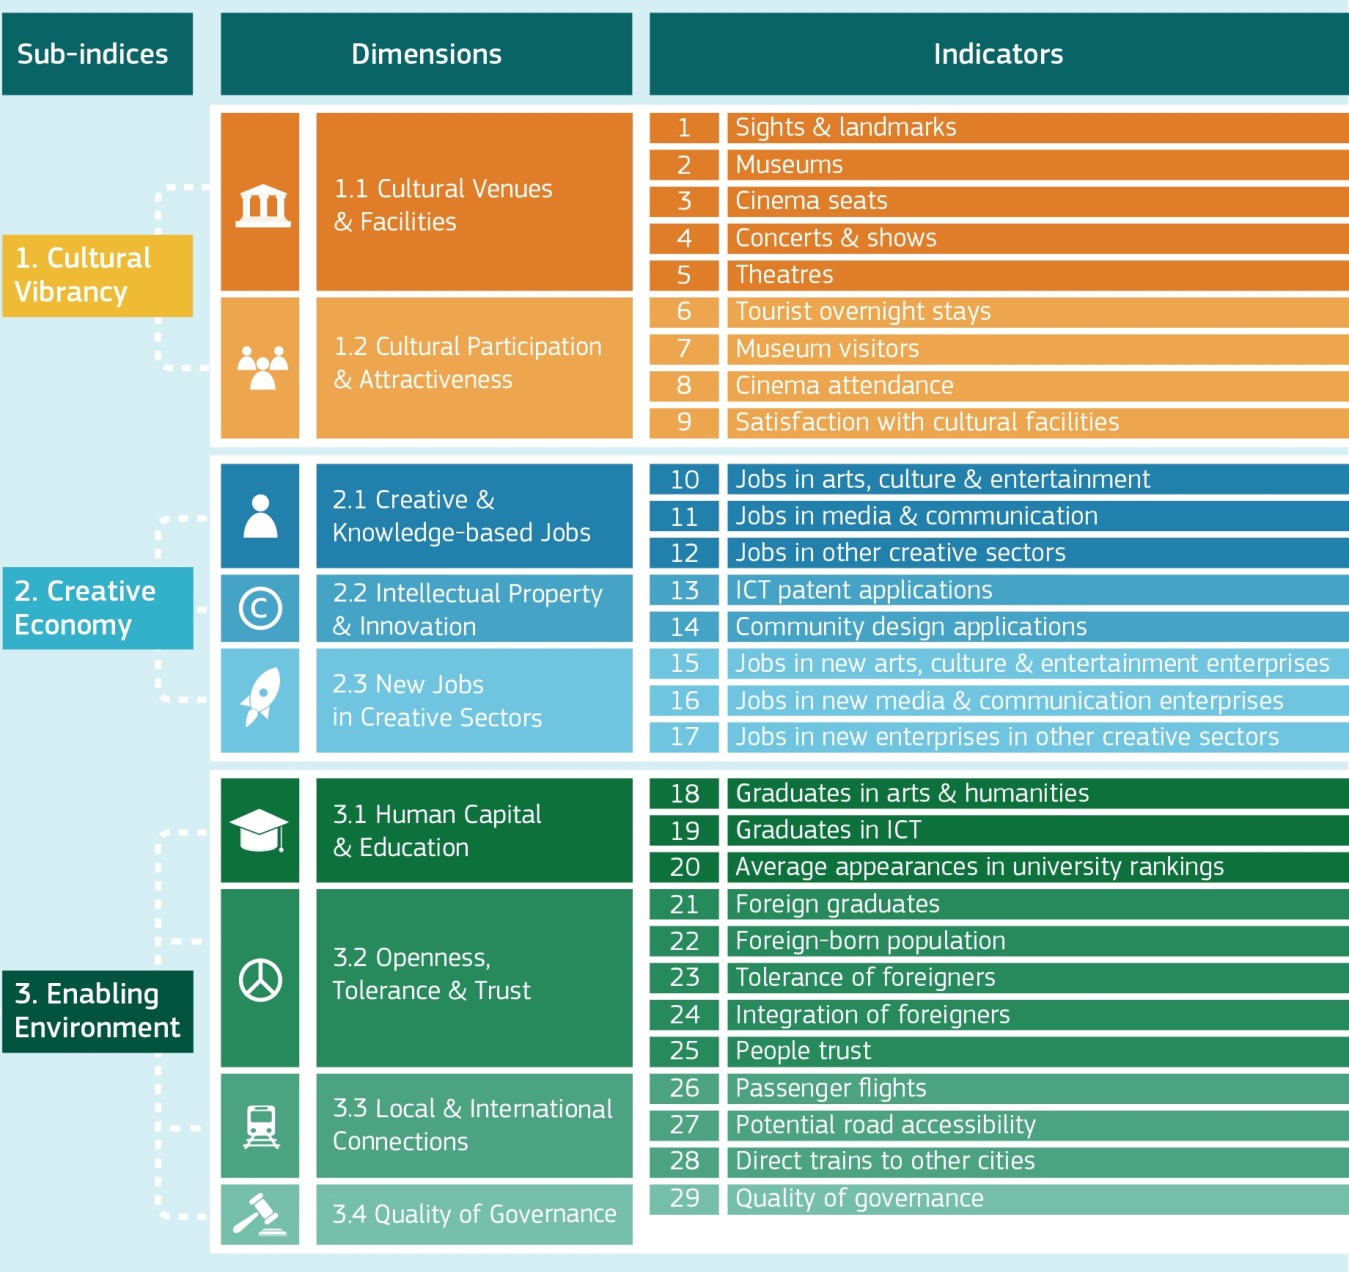
Figure 1. Cultural and Creative Cities Monitor’s conceptual framework and indicators Pulled from the Cultural and Creative Cities Monitor website
CVSuite uses the Creative Vitality Index (CVI) to compare the per capita concentration of creative activity in two regions. Data on creative industries, occupations, and cultural nonprofit revenues are indexed using a population-based calculation. The resulting CVI value shows a region’s creative vitality compared to that of another region.
Where Data Come From
One core difference between the Monitor and the CVSuite/CVI are the data sources. The Monitor provides a comprehensive perspective on creativity and aspects that encourage creativity in communities. They do this by including data from six distinct sources, which range from TripAdvisor to Eurostat. Some data sets are complete and some have gaps. They also include survey data. CVSuite’s data are different in that they primarily come from three sources that are national in scope and do not have any gaps or missing regions. Essentially, the Monitor strives for breadth with their data, while the CVSuite strives for depth.
The Tool
The Monitor’s interactive tool easily allows you to compare the overall performance of your city at a glance. One particular strength of this tool is the ability to compare like cities based on GDP, population, or employment. For example, if you are investigating the data by population, cities would be grouped into their appropriate category (XXL, XL, L…and so on). This approach makes it much easier to see the rank of cities by the C3 Index or one of the three major areas, including Cultural Vibrancy, Creative Economy, y Enabling Environment, or by the nine dimensions measured within these areas.
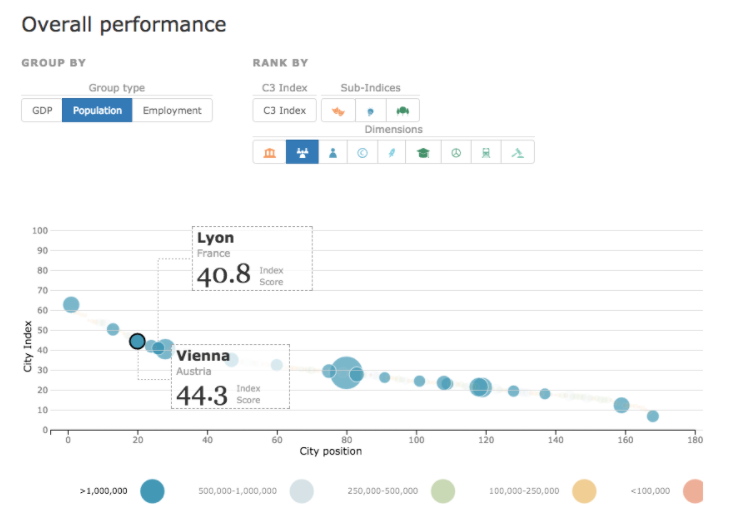
Figure 2. Cultural and Creative Cities Monitor Interactive Tool
The way the interactive tool was designed makes it is easy to benchmark your city against other cities and see what dimensions you want to improve. The graph above (figure 2) facilitates this process. The graph shows that, of cities with populations of 1 million or greater, Vienna and Lyon rank within the top 25% range for the dimension of Cultural Participation y Attractiveness.
The Cultural and Creative Cities Monitor Report
In addition to the tool, The Cultural and Creative Cities Monitor 2017 edition was released. The report describes the tool and highlights what the index found within the 168 cities measured. Some key findings found in the report are listed below:
- The top cultural and creative cities in their respective population groups are:
- Paris is in first place for cities with more than 1 million inhabitants. According to the report, Paris leads in museum visitors, is in second place in nine of the other indicators within the Cultural Vibrancy index. Furthermore, Paris leads in indicators related to jobs and job creation in the creative and cultural sectors.
- Copenhagen is in first place for cities with 500,000 to 1 million inhabitants. According to the report, Copenhagen leads in Theatres within the Cultural Vibrancy index. Within the Enabling Environment index, Copenhagen ranks first in trust and quality of governance.
- Edinburgh ranks in first place for cities with 250,000 to 500,000 inhabitants. According to the report, Edinburgh ranks 4th on three indicators within the Cultural Vibrancy index, including sights and landmarks, museums, and concerts/shows.
- Eindhoven leads among smaller cities with populations of 50,000 to 250,000. Eindhoven ranks first in cinema within the Cultural Vibrancy index. It leads in jobs in other creative sectors, ICT patent applications, and community design applications within the Creative Economy index.
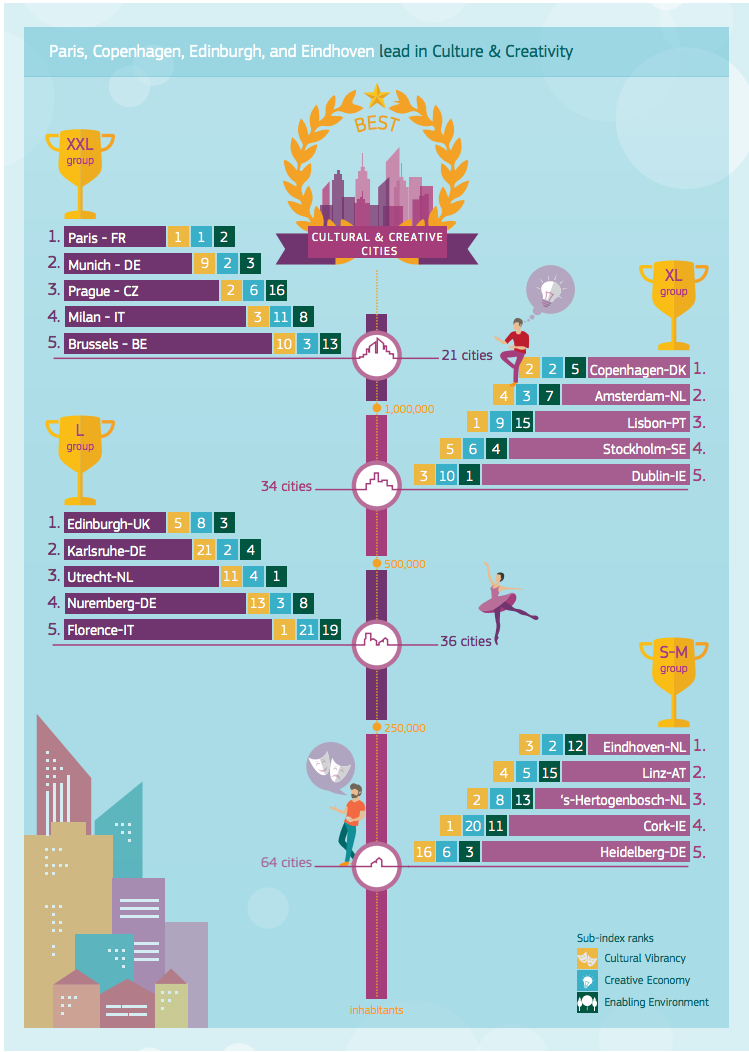
Screenshot of Figure 2 of 2017 Cultural and Creative Cities Monitor (Top 5 cities in the C3 Index per population group)
- Capital cities tend to have higher index values, but may not be the top-performing cities. According to the report, “This departure is even more prominent in the Cultural Vibrancy sub-index: In 15 countries, non-capital cities–mostly of medium size–outperform capitals. “
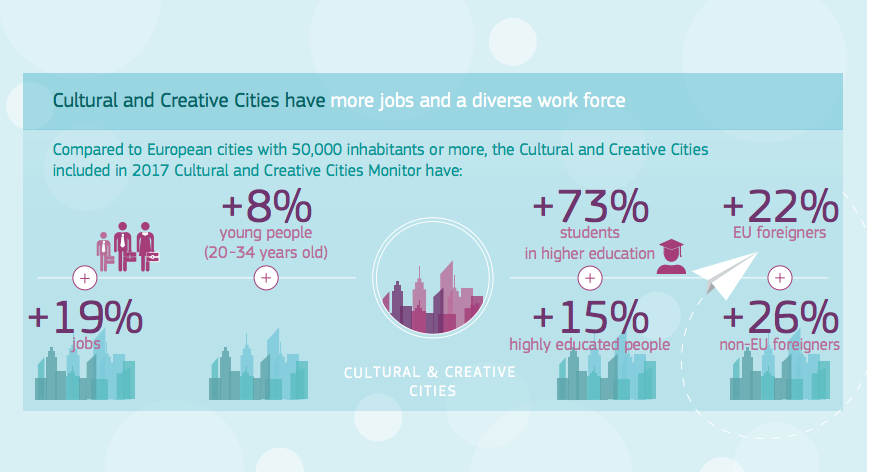
- Cultural and creative cities have:
- 19% more jobs per capita (or 7.55 percentage points (p.p.));
- 8% more young people (20-34 years old) per capita (1.76 p.p.);
- 73% more students in higher education per capita (a difference of 4.85 p.p.) and 15% more highly educated people per capita (2.65 p.p.);
- 22% more EU foreigners (0.13 p.p.) and 26% more non-EU foreigners (0.56 p.p.) per capita.
The CVSuite team encourages you to review the full 2017 Culture and Creative Cities Monitor report, which can be found here.
Conclusion
El Cultural and Creative Cities Monitor is an inclusive tool for measuring the creative economies of European cities. It allows cities within Europe to compare, review, and analyze their cultural and creative impact. Looking at other creative economy comparison tools, such as the Cultural and Creative Cities Monitor, allows you to identify the items that are effective in those tools and apply them to your work with the CVSuite.

CaFÉ es un sistema de presentación de solicitudes en línea que se esfuerza por poner las oportunidades artísticas al alcance de todos, ofreciendo a las organizaciones artísticas una plataforma de presentación asequible y a los artistas una forma fácil de presentar su solicitud.
GO Smart es un software asequible de gestión de subvenciones que ofrece formularios previos y posteriores a la solicitud, revisión de paneles e informes de datos para los donantes.

El Archivo de Arte Público (PAA) es una base de datos en línea gratuita, con capacidad de búsqueda y en continuo crecimiento de obras de arte público terminadas en todo Estados Unidos y en el extranjero, con un conjunto de recursos y herramientas creados para gestionar colecciones de arte público.

ZAPP proporciona a los administradores de ferias y festivales de arte un conjunto de herramientas para recopilar digitalmente las solicitudes y formar parte del jurado, gestionar los pagos de los stands y comunicarse con los solicitantes, todo ello en una plataforma digital fácil de usar. Los artistas pueden inscribirse en cientos de ferias de todo el país a través de un sitio web central.