


Web Services powered by
Toe fo'i i Tala Fou uma
Part 3 of 5: Our Creative Roots, Challenges of Analyzing Rural Regions
January 18, 2017
Review of CVSuite report : A Guide to Creatives in Rural California
An Analysis of Economic Activity in the Creative Sector in California’s Rural ZIP Codes
The third post in the Our Creative Roots series looks at the report A Guide to Creatives in Rural California. The report was produced by the Creative Vitality Suite team. This post investigates how the report defines rural regions. It also reviews the distribution of creative jobs and industries in rural areas of California.
Our Creative Roots Blog Series
Part 1: Thoughts on Measuring a Community’s Creative Vitality
Part 2: Impact and the Homegrown Entrepreneur
Challenge of Defining a Rural Region
When exploring data for a region, a researcher first needs to identify the preferred geographic boundaries of the region being researched. The next step is to investigate whether data is available in segments that alone or in aggregation overlay the preferred study boundaries. In some instances, an already defined metropolitan statistical area may be an exact overlay of the selected region of study. In other instances, a city boundary or a combination of counties may be used to define the researcher’s geographic target area. In yet other instances, a grouping of ZIP Codes, with data available for each may come closest to the preferred shape of the study region.
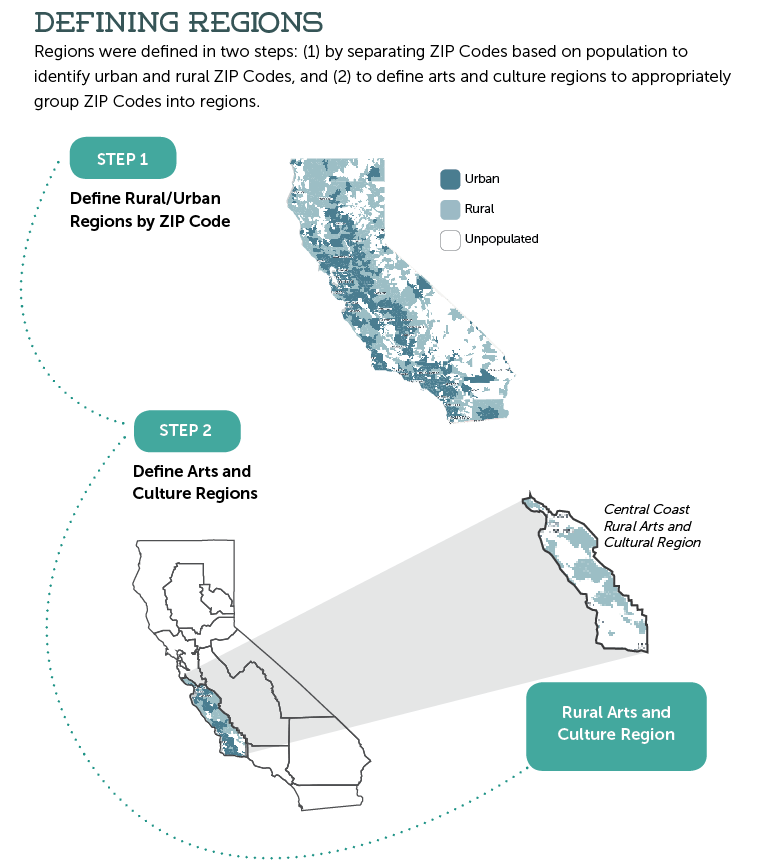
Rural regions can be challenging to define because locating geographic segments with related data can be difficult. Rural regions can spread across vast areas that, if they are lightly populated, may have very limited data associated with them. For this report, the research process began with an investigation of data at both the micropolitan and the metropolitan statistical areas. What was soon discovered, however, is that these regions were often not effectively separating out the rural areas we wanted to investigate. To address this issue, the researchers began looking at ZIP Codes and aggregations of ZIP Codes as ways to define areas in which to conduct analyses. This report defined rural areas in two overlying ways. Following is a description of the process used to define them:
Step 1: Identify Rural ZIP Codes (See image 1)
California rural areas were identified according to the United States Census Bureau’s definition of what comprises a rural ZIP Code. The result was a list of 541 ZIP Codes within California that were defined as “rural.”
Step 2: Group ZIP Codes by Cultural Region (See image 1)
The ZIP Codes were placed within an already accepted geographic framework of California regions. Across California state government, there are many ways to divide the state into regions. For the purposes of this study, the regional breakdown of California that was used was the regional breakdown as defined in the 2011 report, California’s Arts and Cultural Ecology Report*. This regional breakdown was selected because it was already embraced by California’s arts and foundation communities. While data from a single ZIP Code area may be of interest to some, that unit of measurement is very small and often better understood when aggregated with other rural ZIP Codes in a larger definable region.
Image 1
Rural Regions and Finding Data
Economies in rural regions are unique and remarkably different from those in urban areas, but they often are measured with the same metrics that are to assess urban economies. These smaller communities often have fewer people living across larger spaces and in many regions they do not have the population density to support the variety of industries found in urban areas. Some communities lack data on smaller creative industries and occupations, making it challenging to understand their impact on the creative economy.
Although no national level source can capture every worker, the CVSuite combines multiple sources of data. This includes data that captures creative workers working in the arts as a secondary source of income. These data are more comprehensive than looking at any single source of occupational data.
Trends in Rural Regions Across the State
This report looks broadly at rural regions across California. In addition to differentiating California regions by southern or northern, the report divides them further into 10 cultural regions across the state. It examines trends by comparing regions across the entire state, which allows for the identification of trends in rural areas.
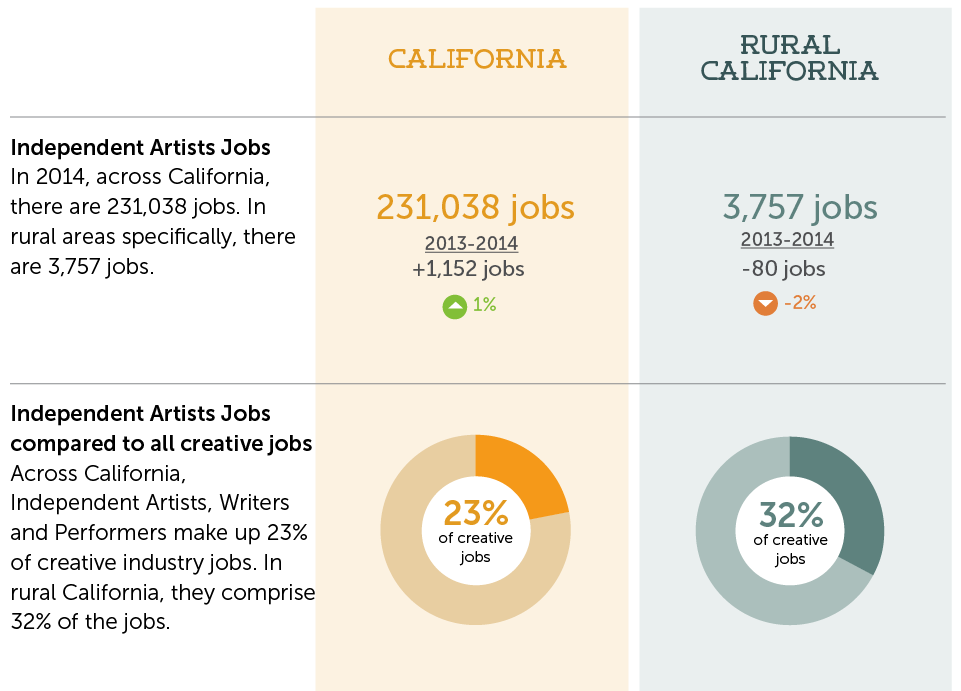
The report highlights trends for independent artists, writers and performers*. In 2014, 22% of all workers in creative industries** within California fit into the “independent artists, writers and performers” group. When looking at the same group in rural areas, we see a value 10% higher than the state average, with 32% of creative industry workers in this group. See Image 2
Image 2
Although the use of data is becoming more routine for decision making in many industries, the creative industries, specifically in rural regions, are plagued with the challenge of providing insights on the basis of very little data. This report approaches that data deficit differently by grouping rural areas by cultural regions, which helps to identify broader trends across the state. Although this may not be the most actionable way of helping individual rural regions and their distinct creative activities, it helps state-level agencies craft policies that better meet the needs of all rural areas in the state.
The Creative Vitality Suite released A Guide to Creatives in Rural California in November 2016.
For a deeper dive into the findings, please download the report. For technical information about methodology and data sources, download the technical appendix.
*Markusen, Ann and Anne Gadwa.2011.California’s Arts and Cultural Ecology, Technical Appendix. pg 9 -10. California: The James Irvine Foundation
**This report includes data from 64 selected NAICS codes. The census site explains: “The North American Industry Classification System (NAICS) is the standard used by federal statistical agencies in classifying business establishments for the purpose of collecting, analyzing, and publishing statistical data related to the U.S. business economy. NAICS was developed under the auspices of the Office of Management and Budget (OMB), and adopted in 1997 to replaced the Standard Industrial Classification (SIC) system.

O le CaFÉ ose faiga tu'uina atu i luga ole laiga e taumafai e fa'aavanoa avanoa ata mo tagata uma e ala i le tu'uina atu o fa'alapotopotoga fa'ata'ita'i se fa'ailoga taugofie ma tufuga se auala faigofie e fa'aoga ai.
GO Smart ose polokalama fa'ameaalofa taugofie e tu'uina atu ai fomu a'o le'i faia ma pe a mae'a talosaga, iloiloga a le laulau, ma lipoti o fa'amaumauga mo le au foa'i.

O le Public Art Archive (PAA) ose fa'amaumauga e leai se totogi, su'esu'e, ma fa'aauau pea le fa'atupuina o fa'amaumauga i luga ole laiga o galuega fa'atino a tagata lautele i totonu o le Iunaite Setete atoa ma fafo, fa'atasi ai ma le tele o punaoa ma meafaigaluega ua fausia mo le fa'afoeina o fa'aputuga fa'atagata lautele.

E tu'uina atu e le ZAPP i le au fa'atauga fa'ata'ita'iga ma fa'afiafiaga fa'atasi ai ma se vaega o mea faigaluega e aoina fa'atekinolosi ma fa'atonu tusi talosaga, fa'atautaia totogi o fale'oloa, ma feso'ota'i ma tagata talosaga uma i se fa'aoga fa'afuainumera faigofie e fa'aoga. E mafai e le au tusiata ona talosaga i le faitau selau o faʻaaliga i le atunuʻu atoa e ala i se upega tafaʻilagi tutotonu.